
Time Tracking ROI: Calculate What It Saves You
How much does time tracking actually save? Here's how to calculate the real ROI for your business with formulas, benchmarks, and the numbers that matter.
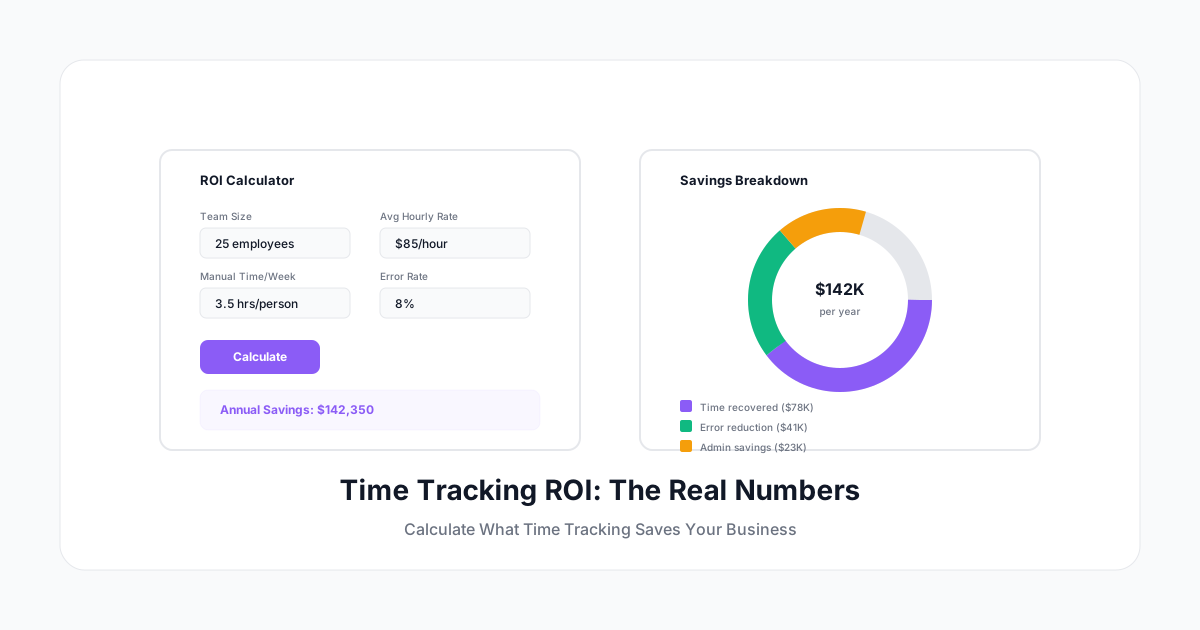
"How much does time tracking actually save us?" Every CFO, operations lead, and team manager asks this question before investing in a time tracking tool. Fair question.
The problem is most companies can't quantify the cost of NOT tracking time. They know it's "probably costing something" — but the number feels abstract. So they stick with spreadsheets, or nothing at all, and keep bleeding money in invisible ways.
Here's how to calculate the actual ROI of time tracking for your specific business — with real formulas, benchmarks, and the numbers that matter to decision-makers.
The Hidden Costs of Not Tracking Time
Cost 1: Unrecovered Billable Hours
If you bill clients for your team's time, every hour that isn't tracked is an hour that can't be billed. Industry data shows:
- Manual tracking (spreadsheets, end-of-week timesheets): Captures 68% of actual billable work
- Automated tracking (real-time timers, suggestions): Captures 91%+ of billable work
- No tracking (gut-feel invoicing): Captures roughly 50-60% of billable work
The gap: If your team works 1,000 billable hours per month but captures only 680, you're leaving 320 hours un-billed.
Your number: (Total team billable hours × gap percentage) × average billing rate = monthly lost revenue
Example: 10-person team, 160 billable hours each, 68% capture rate, $150/hour billing rate
- Hours lost: 10 × 160 × 0.32 = 512 hours/month
- Revenue lost: 512 × $150 = $76,800/month ($921,600/year)
Even improving capture by 10% (68% → 78%) recovers $24,000/month in this scenario.
Cost 2: Timesheet Errors and Corrections
Manual timesheets have error rates of 1-8%, depending on complexity. Each error requires:
- Someone to identify it
- Communication back and forth
- Re-submission and re-approval
- Payroll adjustment (if caught after processing)
Average cost per timesheet error: $50-200 (including time spent by employee, manager, and payroll)
Your number: (Employees × error rate × pay periods per year) × cost per error
Example: 50 employees, 5% error rate, biweekly payroll (26 periods), $75/error
- Errors per year: 50 × 0.05 × 26 = 65 errors
- Annual cost: 65 × $75 = $4,875/year
This is conservative. For larger teams or complex payroll (shift differentials, multiple rates, overtime), multiply by 3-5x.
Cost 3: Overtime Surprises
Without real-time visibility into hours worked, overtime becomes reactive — you discover it after it's already happened and must be paid.
Proactive overtime management (with real-time alerts) typically reduces unplanned overtime by 20-40%.
Your number: (Annual overtime cost × preventable percentage) = savings
Example: $180,000/year in overtime, 25% preventable with better visibility
- Savings: $180,000 × 0.25 = $45,000/year
Cost 4: Project Overruns
Projects without time tracking run over budget 60-70% of the time. Projects with real-time budget tracking run over 30-40% of the time — and the overruns are smaller because they're caught earlier.
Your number: (Average project overrun cost × number of projects) × reduction percentage
Example: Average overrun of $5,000 per project, 20 projects/year, 40% reduction
- Current overrun cost: $5,000 × 20 = $100,000/year
- Reduced to: $100,000 × 0.60 = $60,000/year
- Savings: $40,000/year
Cost 5: Admin Time
How much time does your team spend on timesheet-related admin?
- Employees: 3-7 minutes/day entering time (manual) vs 30-60 seconds (automated)
- Managers: 2-4 hours/week reviewing and approving timesheets (manual) vs 30 minutes (automated)
- Payroll staff: 4-8 hours/pay period reconciling time data (manual) vs 1-2 hours (automated)
Your number: (Total admin hours saved per year) × average hourly cost
Example: 50 employees save 3 min/day, 5 managers save 2 hrs/week, 1 payroll person saves 4 hrs/biweekly
- Employee savings: 50 × 3min × 250 days = 625 hours/year
- Manager savings: 5 × 2hrs × 50 weeks = 500 hours/year
- Payroll savings: 1 × 4hrs × 26 periods = 104 hours/year
- Total: 1,229 hours/year × $50/hr average = $61,450/year
The ROI Formula
Annual ROI = (Total Savings - Total Cost) ÷ Total Cost × 100

Where:
Total Savings = Recovered Revenue + Error Reduction + OT Savings + Overrun Prevention + Admin Savings
Total Cost = Software cost + Implementation cost + Training time
Running the Example Numbers
For our hypothetical 50-person company at $150/hr:
| Savings Category | Annual Value |
|---|---|
| Recovered billable hours (10% improvement) | $288,000 |
| Timesheet error reduction | $4,875 |
| Overtime management | $45,000 |
| Project overrun reduction | $40,000 |
| Admin time savings | $61,450 |
| Total Annual Savings | $439,325 |
| Cost Category | Annual Value |
|---|---|
| Software ($10/user/month × 50) | $6,000 |
| Implementation (one-time, amortized) | $2,000 |
| Training (2 hours × 50 people × $50/hr) | $5,000 |
| Total Annual Cost | $13,000 |
ROI: ($439,325 - $13,000) ÷ $13,000 × 100 = 3,279%
Even if you cut the savings estimates in half (being very conservative), the ROI is still over 1,600%.
ROI by Company Type
Professional Services (Agencies, Consultancies)
Primary ROI driver: Recovered billable hours
These businesses live on utilization rates. Every unbilled hour is direct revenue loss. A 10% improvement in billable capture often equals a 15-20% profit increase because the work was already being done — it just wasn't being billed.
Typical ROI: 20x-50x the tool cost
Construction and Field Services
Primary ROI driver: Overtime management + job costing accuracy
Labor is 70-85% of project costs. Better time tracking directly improves job estimates, catches overtime before it happens, and provides audit-ready records for prevailing wage compliance.
Typical ROI: 10x-30x the tool cost
Startups and Tech Companies
Primary ROI driver: Resource allocation visibility + burn rate management
Knowing where engineering hours go (product vs tech debt vs meetings) helps leadership allocate the most expensive resource correctly. For VC-funded companies, this data directly affects runway calculations.
Typical ROI: 5x-15x the tool cost (harder to quantify but strategically critical)
Healthcare and Shift-Based
Primary ROI driver: Overtime prevention + break compliance
Unplanned overtime and break compliance violations are the two largest avoidable labor costs. Real-time visibility prevents both.
Typical ROI: 15x-40x the tool cost
What to Present to Leadership
When making the business case for time tracking software, focus on:
For the CFO
- Hard dollar savings (overtime reduction, error prevention)
- Revenue recovery (billable hours captured)
- Payback period (typically under 30 days)
- Comparison: tool cost vs one month of untracked billable time
For the COO
- Admin time reduction (hours freed for higher-value work)
- Process automation (approvals, payroll sync)
- Project visibility (budget tracking, resource allocation)
- Compliance risk reduction (audit readiness)
For the CEO
- Team capacity utilization (are we sized right?)
- Client profitability (which accounts make money?)
- Operational efficiency (where's the waste?)
- Growth planning (can we take on more work?)
Quick Calculator
Run these numbers for your company:
Step 1: Team size × average billing rate × monthly billable hours × estimated improvement percentage = Monthly revenue recovery
Step 2: Monthly overtime cost × 25% reduction = Monthly OT savings
Step 3: Hours spent on admin weekly × hourly cost × 50% reduction × 52 = Annual admin savings
Step 4: Add it up. Compare to tool cost ($8-15/user/month for most solutions)
Step 5: Calculate payback period (total annual cost ÷ monthly savings = months to break even)
For most businesses, the payback period is under 2 months. For service businesses billing hourly, it's often under 2 weeks.
The Intangible ROI
Some benefits are harder to quantify but still real:
- Better client relationships through transparent billing
- Improved project estimates based on historical data
- Reduced employee stress from clear expectations and fair workload distribution
- Data-driven hiring decisions based on actual capacity
- Retention from teams that feel their time is respected and fairly managed
Start With a Pilot
If you can't get budget for a full rollout, propose a pilot:
- Pick one team (5-10 people)
- Track for 30 days
- Measure: hours captured, overtime visibility, admin time
- Calculate the ROI for that team
- Extrapolate to the full organization
One month of data from one team usually makes the business case obvious.
A Human Time offers a 14-day free trial — perfect for a pilot. See the real numbers for your team before committing to a full rollout. When the ROI speaks for itself, the decision is easy.
Time tracking isn't a cost. It's a revenue recovery tool, a compliance safeguard, and an operational intelligence system. The only companies that shouldn't invest in it are the ones who don't value their team's time.