
Time Tracking for Startups: Track Burn, Not Butts in Seats
At the startup stage, time is MORE precious than at any other stage. Here's how to track it without adding enterprise overhead.
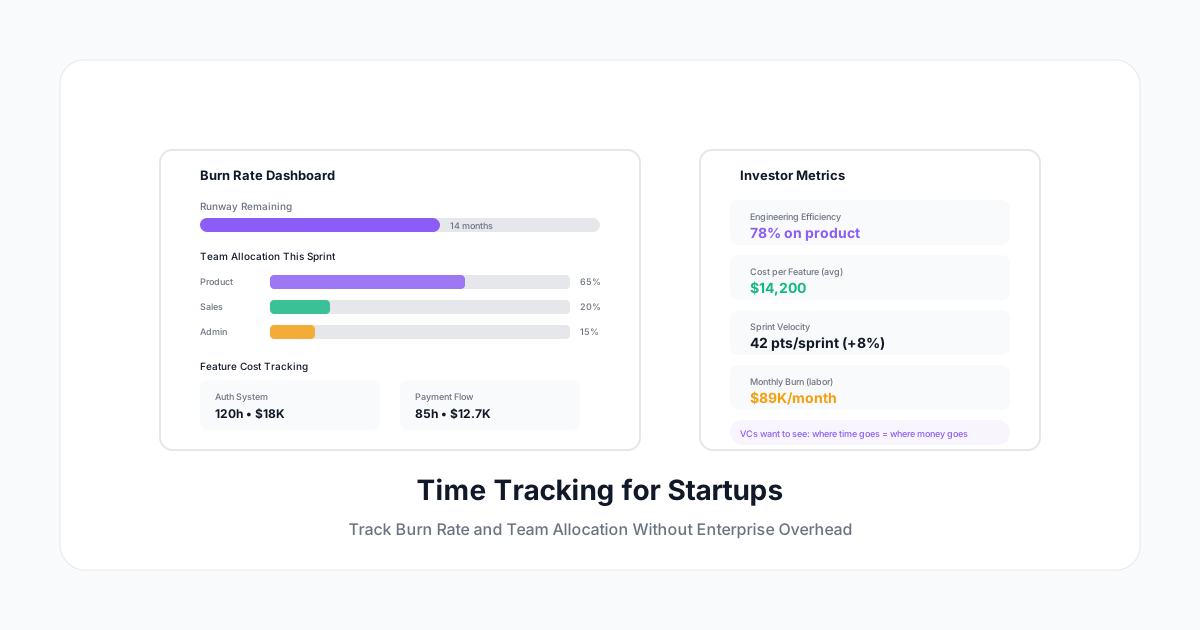
When you're a 5-person startup burning $80K/month in runway, "time tracking" feels like corporate overhead. You're moving fast. Everyone wears multiple hats. Tracking hours seems like something big companies do — not scrappy startups.
But here's what experienced founders know: at the startup stage, time is MORE precious than at any other stage. You have limited runway, limited people, and unlimited things to build. If you can't see where those hours go, you can't optimize the one resource that determines whether you succeed or run out of money.
This isn't about timesheets and approvals. It's about understanding where your burn goes, communicating efficiently with investors, and building the operational habits that scale.
Why Startups Should Track Time
Reason 1: Runway = Time × Burn Rate
Your runway isn't just about money. It's about how effectively you convert money into progress. Two startups with identical burn rates and cash positions can have wildly different effective runways if one allocates time better.
The question time data answers: "Are we spending our hours on the things most likely to extend runway or generate revenue?"
If 40% of engineering time goes to internal tools instead of product features, that's a strategic problem hiding in plain sight.
Reason 2: Investors Ask "Where Does Time Go?"
After Series A, investors want to see engineering efficiency metrics:
- What percentage of engineering time is on product vs tech debt vs infrastructure?
- What's your cost per feature delivered?
- How does velocity trend over time?
- What's your product-to-support time ratio?
If you start tracking at Series A, you have zero historical data. If you start at seed stage, you have 12-18 months of trend data when investors ask.
Reason 3: Knowing When to Hire
"We need another engineer" is a feeling. "Engineering is at 95% utilization for the past 6 weeks and feature delivery has slowed 30%" is data.
Time tracking tells you:
- Is the team actually at capacity, or is time going to low-value activities?
- Which function needs the hire? (Engineering? Design? Ops?)
- Can you redistribute current capacity before hiring?
Hiring too early burns runway. Hiring too late burns the team. Time data helps you find the right moment.
Reason 4: Feature Costing
"That feature cost us $45K in engineering time" changes how you prioritize.
When you know the time cost of everything you build:
- You can calculate customer acquisition cost more accurately
- You can price features for enterprise tiers based on build cost
- You can kill features that cost more to maintain than they generate
- You can make better build-vs-buy decisions
Startup Time Tracking (Without the Overhead)
What to Track
Keep it minimal. Startups don't need 50 project codes. You need 5-8 categories:
Essential Categories:
- Product development — Building new features
- Tech debt / infrastructure — Maintenance, upgrades, scaling
- Customer support — Handling user issues
- Sales / business development — Calls, demos, proposals
- Admin / ops — Internal processes, tooling, finances
- Marketing / growth — Content, ads, community
Optional Categories (when relevant): 7. Fundraising — Investor meetings, deck prep, due diligence 8. Hiring — Recruiting, interviews, onboarding
That's it. Don't over-engineer the categories. The goal is seeing the high-level allocation, not micromanaging tasks.
How to Track (With Minimal Friction)
For founders: Log at the end of each day. 2 minutes max. "Today I spent 3h on product, 2h on sales, 1.5h on fundraising, 1.5h on ops."
For engineers: Timer-based. Start timer when beginning a coding block. Tag it product or tech debt. Stop when switching to something else.
For everyone: Weekly review (10 minutes as a team). "Here's how our collective 200 hours broke down this week."
What NOT to Track
- Individual daily hours (you're not monitoring people — you're understanding allocation)
- Break time (irrelevant at this stage)
- "Productivity scores" (toxic for startup culture)
- Anything that creates more than 5 minutes of overhead per day
Reading the Data
Healthy Startup Time Allocation
At different stages, healthy allocation looks different:
Pre-Product-Market Fit (Pre-revenue):
- Product: 60-70%
- Customer discovery/sales: 15-25%
- Everything else: 10-15%
If product is below 50%, you're not moving fast enough toward PMF.
Post-PMF, Pre-Series A:
- Product: 45-55%
- Sales/growth: 20-30%
- Support: 10-15%
- Everything else: 10-15%
Sales time should increase as you validate channels.
Post-Series A, Scaling:
- Product: 40-50%
- Sales/growth: 20-25%
- Support/success: 15-20%
- Ops/admin: 10-15%
- Hiring: 5-10%
Ops and hiring become meaningful time sinks during scaling.
Red Flags in the Data
- Support > 20% pre-scale: Your product has quality issues eating capacity
- Admin > 20% ever: Too much process overhead for the stage
- Tech debt > 30%: Previous shortcuts are compounding
- Fundraising > 25% for more than 2 months: Raise is taking too long, draining capacity
- Product < 40% post-PMF: Growth activities are crowding out building
- Any person at 55+ hours/week for 4+ weeks: Burnout incoming
Using Data for Sprint Planning
At weekly planning:
- Review: "Last week, 35% of engineering went to bug fixes instead of planned features. Why?"
- Decide: "This sprint, we're capping support at 15% of engineering time. Anything over gets deferred."
- Track: "Did we hit the allocation? If not, what pulled us off plan?"
This isn't micromanagement — it's strategic prioritization backed by data.
Communicating With Investors
Board Deck Metrics (From Time Data)
Include in your monthly/quarterly investor update:
- Engineering efficiency: % of engineering time on product vs other
- Feature velocity: Features shipped / engineering hours invested
- Burn allocation: Pie chart of where total team hours go
- Hiring signal: Utilization rates suggesting when next hire is needed
Due Diligence Preparation
For Series A/B due diligence, having 12+ months of time data lets you answer:
- "How long does a typical feature take?" (with data, not estimates)
- "What's your engineering productivity trend?" (improving or degrading)
- "How do you allocate resources across product/growth/support?" (with precision)
- "What's your cost per unit of output?" (calculable from time × cost)
Founders who can answer these questions with data signal operational maturity.
Scaling the System
Stage 1: 2-5 People (Keep It Dead Simple)
- One shared spreadsheet or basic time tracker
- 5-8 categories
- Weekly 10-minute review
- Founder sets the example by tracking their own time
Stage 2: 5-15 People (Light Structure)
- Adopt a proper tool (the spreadsheet breaks at scale)
- Add team-level reporting
- Monthly allocation review with leadership
- Start tracking per-project costs for major initiatives
Stage 3: 15-50 People (Department-Level Tracking)
- Track by team AND by project
- Set allocation targets by department
- Use data for hiring justification
- Begin tracking utilization for client-facing roles
- Integrate with project management tools
Stage 4: 50+ People (Full Operational Visibility)
- Time tracking becomes standard operating procedure
- Budget tracking per project/initiative
- Cross-functional resource allocation visibility
- Integration with finance/accounting for burn analysis
- Historical data feeds forecasting models
Tools for Startups
What matters at startup stage:
- Free or cheap (no per-seat enterprise pricing)
- Fast to set up (10 minutes, not 10 days)
- Low daily friction (under 2 minutes/day overhead)
- Team visibility (everyone sees the allocation)
- Scales up (won't need to migrate at 30 people)
What doesn't matter yet:
- Compliance features (overtime, breaks)
- Invoicing/billing (unless you're agency-model)
- Complex approval workflows
- Enterprise integrations
The Founder Time Audit
Before rolling this out to the team, try it yourself for 2 weeks:
Day 1-14: Track your own time across all activities.
You will likely discover:
- You spend more time in "admin" than you thought (often 20-30%)
- Meetings consume more capacity than calendars suggest
- Context-switching creates invisible overhead
- One or two activities are disproportionately eating your week
Day 15: Review the data. Ask: "Is this how I should be spending my time given where the company needs to go?"
Almost every founder who does this exercise changes their weekly allocation. The data is that powerful.
Bottom Line
Startup time tracking isn't about bureaucracy. It's about the most important question at the startup stage: "Are we spending our limited hours on the things that matter most?"
You have 18 months of runway. You have 5 people. You have hundreds of things to build, sell, and fix. The only way to know you're allocating correctly is to measure.
A Human Time offers a 14-day free trial that's perfect for early-stage teams: fast setup, minimal daily friction, team-wide allocation dashboards, and the ability to scale into full project tracking as you grow. Start tracking in 5 minutes, get your first insights by end of week.
Time is the startup's scarcest resource. Measure it like it matters — because it does.